Joanna Watson16 Sep 2020
I love maps, especially old maps but I have never been very excited by the idea of data. I can engage imaginatively with the graphics and symbols on an Ordnance Survey map but I always associate data with columns and figures on a spreadsheet, and that fails to inspire. Which is why the work that Tim Richards of Terra Sulis has done for Friends of the Earth has both ambushed and intrigued me.
The challenge to find land for trees
Friends of the Earth has been campaigning to double tree cover in the UK as a natural solution for carbon drawdown and we have identified areas of greenbelt around cities as a priority for planting trees.
At the same time, we need to work alongside nature-friendly regenerative farming and not be seen to be competing for good quality farmland which would only alienate farmers and landowners. This is the essential dilemma for people wanting to see more tree planting – where and how do you find the right spaces for trees? Strategic regional planning maps don’t do the job. They don’t help people make decisions about the best places to support nature, store carbon or work at parish or neighbourhood level. They don’t make the case to landowners.
Could we make a map that works for local campaigners?
We wondered whether there could be a way to map the potential for re-imagining the land, to help mitigate flood risk and promote nature recovery.
Working with Tim Richards was the first step in developing a prototype for a user-friendly map that we hope could work as a powerful engagement and mobilisation tool. To go beyond the headline campaigners’ vision of doubling tree cover to an improved understanding of where new trees could actually go and to help trees activists engage with landowners.
What did Tim do?
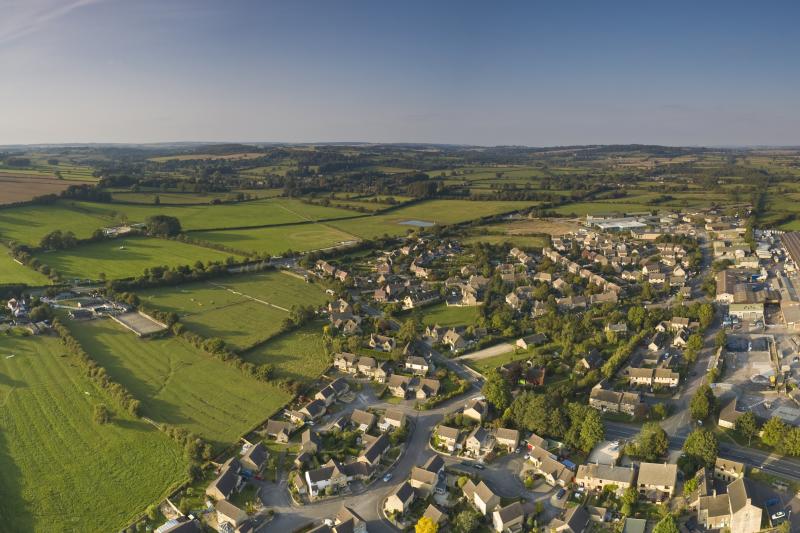
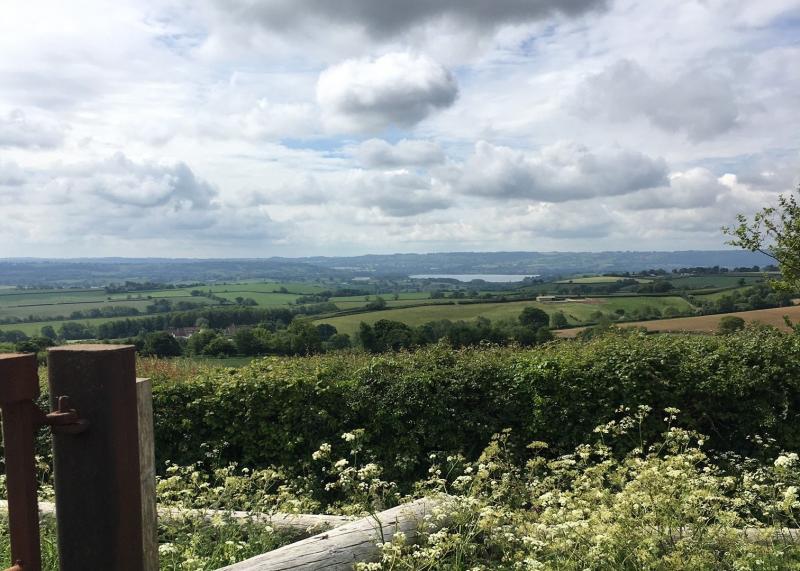
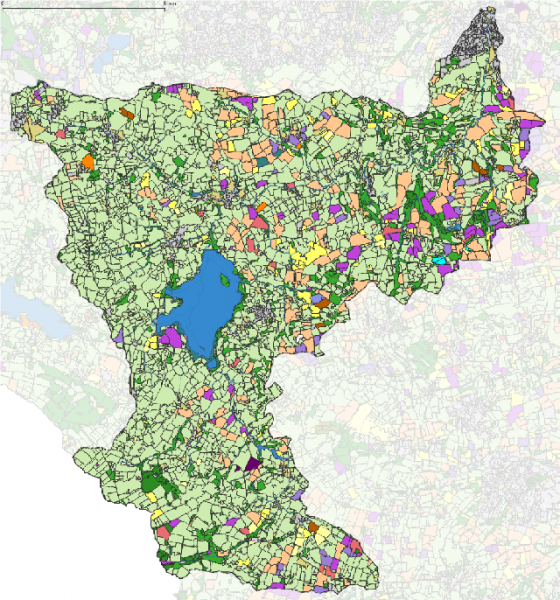
Tim Richards had two tasks – to draw on existing open source data to create an atlas of maps that would provide different sets of information at parish level and turned into webpages. These could be used by activists and landowners to find spaces for trees, where benefits to the community could be maximised while impacts on sensitive ecology and agriculture kept to a minimum. The prototype was based on the potential for woodland creation in the Chew Valley, in Bristol’s greenbelt.
His second task was to develop more detailed spatial information for newly-formed community group Chew Valley Plants Trees (CVPT) relating to land ownership, hedgerows and small woodlands, agroforestry and grasslands. These maps were directly based on their needs.
What do these maps show?
Consisting of six maps and a table of statistics, the Chew Valley atlas provides a detailed description of the parish including the general landform, location of water features, roads, buildings and the parish boundary; existing and opportunity woodland; protected areas and priority habitats; field boundaries and the location and extent of arable and persistent pasture.
A little help from historic mapping
A finding that intrigued me was how using OS maps from the 1880s, Tim can plot lost hedgerows, hedgerow trees, lone trees and significantly for the one-time cider county of Somerset, the number of lost orchards. Grade 1 arable land (the highest quality) today is similar to that in 1880 but most of the orchards have disappeared.
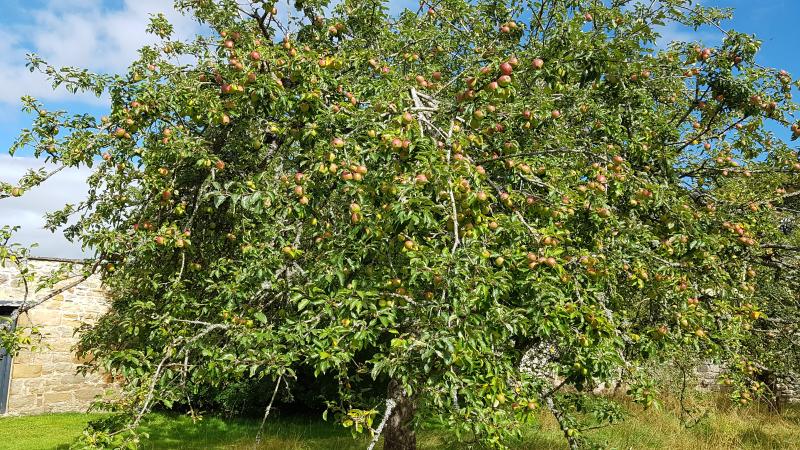
Using old maps enables us to see where land use has changed or stayed the same and gives an improved insight as to where trees could be reinstated and grow successfully. Thus demonstrating the potential for agro-forestry, specifically silvopasture and silvoarable and even fruit tree-based farming with the reinstatement of lost cider orchards, once typical of Somerset.
What did we learn?
We can see that by starting with a different brief, the use of existing data can deliver fresh insights and information, even revealing lost landscape knowledge that can become relevant again today.
We found that there is more than enough space to double tree cover without planting on prime arable land. We learned there is greater potential than some other maps suggest. Because Tim’s maps work at a more granular level – on the margins and small niches – and not just the big parcels of land, the findings may not only be more attractive to landowners but also help build the case for more ambitious targets from the Government.
However, as Tim drily notes: “Only some people read reports. Making reports and maps available doesn’t mean that people read or look at them”.
His report also observes that it can be difficult to identify landowners from mapping and important to only target those whose land intersects with woodland potential. Local knowledge may be useful to supplement the often expensive and laborious process of identifying land ownership via the official method of the government's Land Registry, which remains largely closed off behind paywalls and restrictive licensing.
During the course of this project, however, the Land Registry and Ordnance Survey relaxed some of their restrictions on use of their land ownership mapping data - meaning that crowd-sourced mapping might become easier in future. But you still have to pay £3 each time you want to discover who owns a field or property, so much still remains secret.
The Terra Sulis work provides an informative and user-friendly tool but it needs to be used in conjunction with personal contact and conversation.
Using the maps to start conversations with landowners
We talked to Ben Newton from CVPT about how he would use the maps.
Ben leads sub-groups on climate action for the parish council in a small rural parish that has declared a climate emergency. As a data person he recognises that the emotional reasons for planting trees are not enough to persuade and solid data needs to be part of the argument. The maps enable informed discussions to take place - but engagement with landowners or farmers must be socialised over a coffee or a beer. Building trust and personal contact is essential to avoid falling at the first hurdle as farmers can be very defensive about interference. The maps enable the tree activist to understand the land’s potential, reassuring the farmer that they are not suggesting planting in the middle of valuable pasture, for example. It’s also a good idea to walk the land to demonstrate interest and that they know what they are talking about with regard to specific bits of land.
What impact have the maps had?
They have given Ben and others confidence that they have a useful and robust tool and the ability to promote their campaign online and through articles in local media. They now have a website to embed the maps and Tim has created a detailed resource which they can steer interested parties towards.
Advice for local campaigners
Ben suggests that just printing off the maps and sending them to owners of individual parcels of land is not cost-effective. He recommends identifying bigger owners through social means. Then use the pie and a pint approach and talk to a farmer who is known to be sympathetic. Build a relationship with them and they can spread the word or make introductions. Campaigners need to think about the benefits to the farmers, not just the planet – so find out about grants and other sources of funding, talk about orchards, agro-forestry, using the field margins. CVPT overlaps with parish council work which helps in getting to know who’s who and build contacts.
So what next?
At the beginning we wanted to test whether by bringing to life the drawdown potential of greenbelt land, we could support campaigners, drive investment and influence decision- makers. If the questions of “where should the trees go?” and “what kind of forestry is needed where?” are broadly answered, the equally important question of “how is it going to be paid for?” has not. How are eco-system services and carbon drawdown going to be funded?
Tim Richards observes that the mapping is potentially a powerful tool for engagement but is not yet quite complete. It is “a good outcome of a rather roundabout process”. Using data to tell different stories is complex and the parish atlas not easy for activists to replicate. But Friends of the Earth is planning to scale Tim’s work to cover the whole of England and this information is already compiled for all parishes in the country. We are in the process of developing a website tool to generate a map showing the potential for tree cover against a postcode.
A powerful approach
Combining tech with community engagement can build to something really effective. Using this ground-breaking methodology, we’ve come up with findings that challenge received wisdom about how much space there really is for trees.
There will always be choices to be made and local knowledge and contacts will continue to be a powerful force in finding the land to double tree cover. But the maps will give tree campaigners much easier access to the information they need to inspire and drive action in their local area.


